
Historical record of incidents for Buildkite
Report: "Delayed notifications for a subset of customers"
Last updateWe've spotted that something has gone wrong. We're currently investigating the issue, and will provide an update soon.
Report: "Error spike on Test Engine pages API endpoints"
Last updateWe've spotted an error spike on Test Engine pages and API endpoints.
Report: "Delay in processing Test Engine results from S3"
Last updateWe have identified an issue with processing test data uploaded via S3 and are now working through the backlog.
We are investigating an issue with Test Engine results uploaded via S3 not being processed. We will provide a further update in 30min
Report: "Delayed Test Engine results"
Last updateWe've spotted that something has gone wrong with Test Engine result uploads. We have identified the issue and are working on a fix. All requests will processed eventually as there is no data loss. There is a backlog we will have to work through so Test Engine results will be delayed.
Report: "Delays in flaky test identification"
Last updateWe are experiencing delays in identifying flaky test results. We have identified the root cause and are working through the backlog of flaky tests executions and expect this issue to be resolved shortly.
Report: "Degraded performance and request timeouts"
Last updateA post-mortem was published for this incident at [https://stspg.io/hfj24ry7jkbq](https://stspg.io/hfj24ry7jkbq)
We have resolved the issue with bad query plans in our database causing inefficient queries that triggered increased latency and error rates. We continue to investigate the cause and further mitigations that are necessary to prevent the issue from re-occurring.
We are continuing to monitor for any further issues.
We’re seeing improved response times and reduced error rates following a deployment of our change to improve the query plan efficiency. We continue to monitor
We are deploying a change to improve database performance and resolve the incorrect query plan on a single shard. The impact is contained to a subset of customers on the impacted database. We will provide an update in the next 20 minutes on our progress.
We've identified an incorrect database query plan that is affecting some customers. We're working to resolve.
We're experiencing degraded performance and query timeouts for a subset of customers. We're currently investigating the cause.
Report: "High Agent API latency"
Last update_All times are in UTC_ ## **Service Impact** On May 13th from 21:30 till 23:40 a small percentage of customers \(less than 10%\) experienced delays starting builds of up to 5 minutes. On May 14th from 18:10 till 20:30 a different subset of customers \(again less than 10%\) experienced delays starting builds of up to 20 minutes. ## **Incident Summary** On May 13th our engineers were paged at 22:17 \(UTC\) due to high database load. They soon identified an sub-optimal plan was being generated for a key database query used by our backend to fetch the ID of a job assigned to an agent. Due to the high throughput of this query we experienced performance degradation for all agents communicating with the Agent API for the impacted database. At 22:50 our on-call engineers started a manual analyze, but soon concluded it was going to take more than an hour to complete so began investigating alternative workarounds. We deployed an emergency change, behind a feature flag, to hint to the query planner to prefer a more efficient index. This was enabled for all affected users at 23:34. At 23:46 the manual analyze completed and service was fully restored. Recent improvements made to the isolation of the Agent API meant this incident had no impact on customers on other databases. On May 14th at 18:44 \(UTC\), our engineers were automatically paged for high latency on the Agent API. At 19:13 the on-call engineer enabled the previously deployed feature flag for all customers, which partially restored service, and started a manual analyze. At 20:30 service was fully restored. ## **Technical Analysis** The Buildkite Pipelines sharded database contains a jobs table which stores, amongst other things, the state of a job \(scheduled, assigned, running, passed etc.\). When agents are assigned a job our application queries the database for the job ID to return to the agent. Following a post-autovacuum [ANALYZE](https://www.postgresql.org/docs/current/sql-analyze.html) the query used became more expensive and due to the high throughput of this query it resulted in performance degradation for all agents communicating with the Agent API for the impacted database. During an analyze Postgres calculates a `freq` statistic for each value of a column. This value is used to build a most common value histogram, which is used by the query planner to estimate the cost of different queries it could execute. It calculates this by taking a random sample of the table. Since jobs are typically moved from `scheduled` to `assigned` and then `running` very quickly there is typically a very small percentage of rows in this table with the `assigned` state at any one time. This very skewed distribution reduces the accuracy of the analyze statistics, since it’s only sampling a small subset of the table. Over time the distribution of the state column became so skewed that there was a relatively high probability statistics produced by analyze would be inaccurate. This caused the query planner to mis-estimate the number of rows returned by scans of a partial index and wrongly conclude it would be more efficient than using the primary key index. These queries were of high enough throughput that this mis-estimation had a significant impact on database load and resulted in degraded performance of all queries to the jobs table. ## **Changes we're making** We have deployed changes to ensure all queries for jobs in the assigned state use the most efficient query plan. We are investigating how [aurora\_stat\_plans](https://docs.aws.amazon.com/AmazonRDS/latest/AuroraUserGuide/aurora_stat_plans.html) will enable us to detect sub-optimal query plans sooner.
This incident is now resolved. Database and Agent API performance has returned to normal.
We've corrected the issue and are monitoring performance of the affected database shard.
A bad database query plan is causing increased latency and timeouts for some organizations. We're working to correct the issue.
We're experiencing high Agent API latency for a subset of customers. We are working to identify the cause.
Report: "Increased error rates for Agent API"
Last updateThe low level error rates were caused by an increase in database load which is now resolved. We are looking to schedule more regular vacuums to reduce the impact while we work on a long term fix to prevent this issue
We have confirmed that the error rate is not significant, but will continue to monitor the situation as we resolve the underlying cause. We will not provide any further updates unless the situation changes.
We're seeing elevated error rates for some users and are confirming if this is impacting customers. We will provide a further update in 15 minutes
Report: "Delayed notifications to Github"
Last updateThe incident is resolved now that Github is operational.
We've identified the issue is caused by an ongoing incident with Github. We're currently monitoring the impact on our service in case further mitigation is required.
We are investigating delays to build and job notifications such as commit status and other webhooks
Report: "Elevated latency in GraphQL and Rest APIs"
Last updateThe incident has been resolved and everything is operating normally.
The issue has been mitigated, and we are actively monitoring system performance to ensure stability.
We have identified the source of latency, and are working on mitigating the impact.
We're currently investigating increased latency affecting our REST and GraphQL APIs, as detected by our monitoring systems.
Report: "Increased request latency"
Last updateService has returned to normal. We've identified a small number of malfunctioning workers in the API worker pool that were unable to handle requests. This caused some requests to time out. We have cycled the worker pool to ensure any affected workers are removed.
We're experiencing higher than usual request latency. We're currently investigating the issue, and will provide an update soon.
Report: "Increased Agent API Latency"
Last updateDatabase performance has returned to normal.
Database performance is returning to normal levels. Response team are monitoring.
We're continuing to investigate the database performance issue. Impact is isolated to a subset of customers.
We're monitoring a performance degradation in one of our pipelines database shards causing some increase in agent API latency
Report: "Increased latency on artifact uploads"
Last updateThis incident has been resolved.
Artifact upload latency has recovered, and we are monitoring systems
We're currently investigating increased latency on artifact uploads.
Report: "Increased error rates and timeouts"
Last update## **Service Impact** From 00:02 to 00:27 \(UTC\) on March 14th, Buildkite Pipelines experienced increased latency and error rates impacting all customers. Between 00:02 and 00:45 some customers experienced severe performance degradation and periods of time when no builds would have progressed. Similar to the [March 5th incident](https://www.buildkitestatus.com/incidents/sb1z4qc55fdy), the primary impact seen by customers was a delay in the time it took for a Job to be started by an agent, as agents experienced latency and elevated error rates when communicating with the Buildkite API. The below graph shows the average latency experienced by customers between when a build is created and the first job in that build started.  Additionally the Buildkite website experienced increased latency and error rates during this time. ## **Incident Summary** Many customers have [scheduled builds](https://buildkite.com/docs/pipelines/configure/workflows/scheduled-builds) set to run at 0:00 UTC, which results in a spike in the number of builds created and processed at that time each day. March 14th was no exception, but on this occasion this expected spike was on top of some already exceptional load on one of our database instances. This combined load caused high enough concurrency that the database experienced excessive [LWLock:lockmanager](https://docs.aws.amazon.com/AmazonRDS/latest/UserGuide/wait-event.lw-lock-manager.html) contention. When the database reaches this critical point, it enters a state which can only be recovered by shedding load. Our engineers were paged automatically at 00:09 UTC and confirmed that the database had entered this state. Load shedding from the affected database instance began at 00:19 UTC. In previous incidents the chosen mechanism of load shedding \(temporarily halting background processing for the affected database instance\) has had the intended effect very quickly, dropping load on the database within 1 minute. This time the effect was slower, with load on the database recovering over the following 8 minutes. Recovery of the database load restored performance for customers not on that database instance at 00:27 UTC, and our engineers began re-enabling background processing for customers on the impacted database instance, with that completed by 00:45 UTC. ## **Changes we're making** Excessive [LWLock:lockmanager](https://docs.aws.amazon.com/AmazonRDS/latest/UserGuide/wait-event.lw-lock-manager.html) contention has been a common occurrence in past Buildkite Pipelines incidents. Before horizontal sharding, our early efforts to scale our Pipelines database included partitioning some key high-volume Postgres tables, including our builds table. Most queries on these tables have been optimized using [partition pruning](https://www.postgresql.org/docs/current/ddl-partitioning.html#DDL-PARTITION-PRUNING), but there are certain queries where that is not possible. For those queries, “non-fast path locks” must be acquired for every partition \(and index of those partitions\) to find the relevant builds. In the case of this incident, the existing workload on that database instance was performing such queries at a high rate \(unusual across all of our databases\) and the addition of similar queries resulting from scheduled builds at midnight UTC tipped load over the edge. Our efforts to horizontally shard the Pipelines databases have given us a path to remove these now-unused partitions, so our first response to this was to fast-track our plan to detach said partitions from the impacted database shards. This work was completed in the hours following the incident. This has significantly dropped the maximum number of locks used by the database, when compared with the week prior:  We’ve since rolled this change out to all of our database shards. The load this database was under before 0:00 UTC was unusual compared to other database instances, but this partitioning change renders that particular load no longer a concern. Separately, we are always reviewing our platform’s traffic patterns, and this load has highlighted one opportunity to further optimize the performance of queries for annotations. We also reviewed our response time to this incident and have implemented a new monitor that would have triggered 7 minutes earlier during this incident, allowing for a faster response time should a single database instance experience excessive load. These changes reduce the likelihood of a single database instance entering an unhealthy state, and improve our ability to respond quickly should it happen, however our top priority remains improving load isolation between customer workloads, leveraging our newly-sharded databases. We have seen how having isolated background workers has had a sizable positive impact on the stability of our platform, and are currently working on bringing that isolation into our web servers. Our Agent API serves all communication between your agents and our platform, placing it in the critical path for ensuring your builds complete without interruption. As such, it is our first target for isolation – we will be sharing more information about this in the coming weeks.
After isolating an impacted database and shedding load we've seen error rates and latency return to normal.
We've spotted that something has gone wrong. We're currently investigating the issue, and will provide an update soon.
We've spotted that something has gone wrong. We're currently investigating the issue, and will provide an update soon.
Report: "Increased latency and error rates"
Last update## **Service Impact** From 17:33 to 18:20 \(UTC\) on March 5th, Buildkite Pipelines experienced degraded performance impacting all customers. Between 17:33 and 19:10 some customers experienced severe performance degradation and periods of time when no builds would have progressed. The primary impact seen by customers was a delay in the time it took for a Job to be started by an agent, as agents experienced latency and elevated error rates when communicating with the Buildkite API. The below graph shows the average latency experienced by customers between when a build is created and the first job in that build started. Additionally the Buildkite website experienced increased latency and error rates during this time.  ## **Incident Summary** We run several Aurora RDS Clusters for our Pipelines databases, each with a single reader and writer instance. At 17:33 \(UTC\), a hardware failure of the writer instance on one of these clusters resulted in an automatic failover to the reader. This meant that for 9 minutes all database queries were directed to a single database instance, which became overloaded causing queries to time out. This had a knock-on effect of overloading our Agent API which was starved of capacity by the number of requests waiting for a response from the database. Even when the database instance that failed recovered at 17:42, the number of concurrent queries to the new writer instance was too high for it to self recover. Our engineers had been paged automatically at 17:38 due to the high number of errors and at 18:15 we began shedding load to the impacted database instance to reduce concurrency, which restored service to most customers. Our team gradually re-enabled service for customers on the affected database, and by 19:06 job started latency had recovered for the remaining customers. We were still experiencing low level error rates at this point, due to two bugs in the Ruby on Rails framework. After a manual restart of the services the error rate recovered and service was fully restored at 19:19. ## **Changes we're making** Hardware failures are a normal part of running a platform such as Buildkite and this incident has given us insights into how we can better design for this type of failure. This was the first time we’d seen a hardware failure of this kind during peak load and we didn’t anticipate that such failure wouldn’t self recover once the database cluster was back to a healthy state. We have made improvements to the resilience of our platform by improving isolation between database shards since the [January Severity 1 incident](https://www.buildkitestatus.com/incidents/txxkzf4r262c), but we have more work to do, and this incident reiterates the importance of that work. In particular, we brought forward a project to improve load isolation within our Agent API after the earlier incident. Once complete, that isolation will substantially mitigate cross-shard impact in the case of similar incidents. The lessons from the earlier incident were invaluable during this incident as we already had the processes in place to shed load, enabling us to restore service more quickly. We have made the following changes to avoid a recurrence of this issue: * Enabled [Cluster Cache Management](https://docs.aws.amazon.com/AmazonRDS/latest/AuroraUserGuide/AuroraPostgreSQL.cluster-cache-mgmt.html#AuroraPostgreSQL.cluster-cache-mgmt.Monitoring) for faster recovery in the event of a database failover. * Added an additional replica to our database clusters to ensure there’s sufficient capacity during a failover event. Additionally we are investigating ways to reduce the impact of high concurrency on our database, which causes excess time spent by the [LWLock:lockmanager](https://docs.aws.amazon.com/AmazonRDS/latest/UserGuide/wait-event.lw-lock-manager.html). This was also a contributing factor to the aforementioned January incident. When the time spent obtaining “non-fast path locks” reaches a critical point the database gets into a state which can only be recovered by shedding load. By reducing the number of partitions queries have to scan to find data we can reduce the amount of locks that need to be obtained, preventing the database from reaching this critical point. One of the Ruby on Rails bugs we encountered today [has been reported upstream](https://github.com/rails/rails/issues/51780), the second is a bug we have seen before but hasn’t as yet been reported. These cause the Rails database connection pool to sometimes get into an inconsistent state when a database stops responding even for a brief period of time. We will work with the Rails maintainers to get these resolved. Introducing horizontal sharding of our databases has substantially improved the scalability and reliability of our system, but, as with any change, has brought with it new challenges. More databases means hardware failures are going to be more common, and we need to handle those failures gracefully. On this occasion, we were not able to do so, and we acknowledge the impact this had on your use of Buildkite.
This incident has been resolved.
A fix has been implemented and we are monitoring the results.
We have identified and isolated an unhealthy database shard, and have brought the majority of customers back online. We are continuing to restore service to the remainder of customers.
We are continuing to investigate the issue.
We are currently investigating reports of users being unable to access the web app and experiencing increased error rates on the API.
Report: "Increase in error rates on Buildkite website"
Last updateWe have performed an emergency roll back and have confirmed error rated have dropped to normal levels.
We have identified an increase in error rate when browsing Buildkite via the web. API-based operations (including the Buildkite Agent) are unaffected.
Report: "Scheduled builds not running"
Last updateA fix has been deployed, and scheduled builds are running normally.
We've identified the cause, and are currently deploying a fix. This issue only affects some organizations.
We've noticed an issue with scheduled builds. We're currently investigating, and will provide an update soon.
Report: "Internal error spike – No customer impact"
Last updateIn analyzing the impact, we have determined that the only impacted organizations are internal to Buildkite, used only for monitoring purposes. There was no impact to customers in this case.
The rollback has completed, which has resolved the error. Any impacted inbound webhooks have now been reprocessed successfully.
We have performed a rollback, and are seeing error rates returning to baseline levels.
We are observing elevated error rates on webhook ingestion. We're currently investigating the issue, and will provide an update soon.
Report: "Degraded performance"
Last update# Summary Between **2025-01-05 13:30 UTC** and **2025-01-08 19:30 UTC**, Buildkite Pipelines experienced four periods of degraded performance, three of which resulted in outages. The impact varied across customer workloads, primarily affecting the Buildkite Pipelines Agent API and preventing jobs from running to completion. These outages were not caused by any single shard migration but rather by a specific pattern of load that emerged after several migrations from the higher-capacity original database to the newer, targeted database shards, combined with the surge in activity as many organizations returned to work, weeks after the relevant database shard migrations had completed. Each performance issue required specific remediation, revealing new bottlenecks under load. As a result of these issues, we have made several changes. First, extensive mitigations were applied throughout to ensure that customer workloads don’t cause degraded performance and outages; these mitigations are proving to be effective. Second, we've significantly increased capacity across several critical bottlenecks, improving the performance and resiliency of key transactions. Finally, we’ve implemented and tested new controls for load shedding and isolating impact between customer workloads. We recognize the seriousness and impact of this series of outages, and we deeply apologize for the disruption caused. As with any service interruption, resolving this issue was our top priority. Keith Pitt, our technical founding CEO, the leadership team, and our engineering team were deployed to identify and resolve the problems. # Timeline 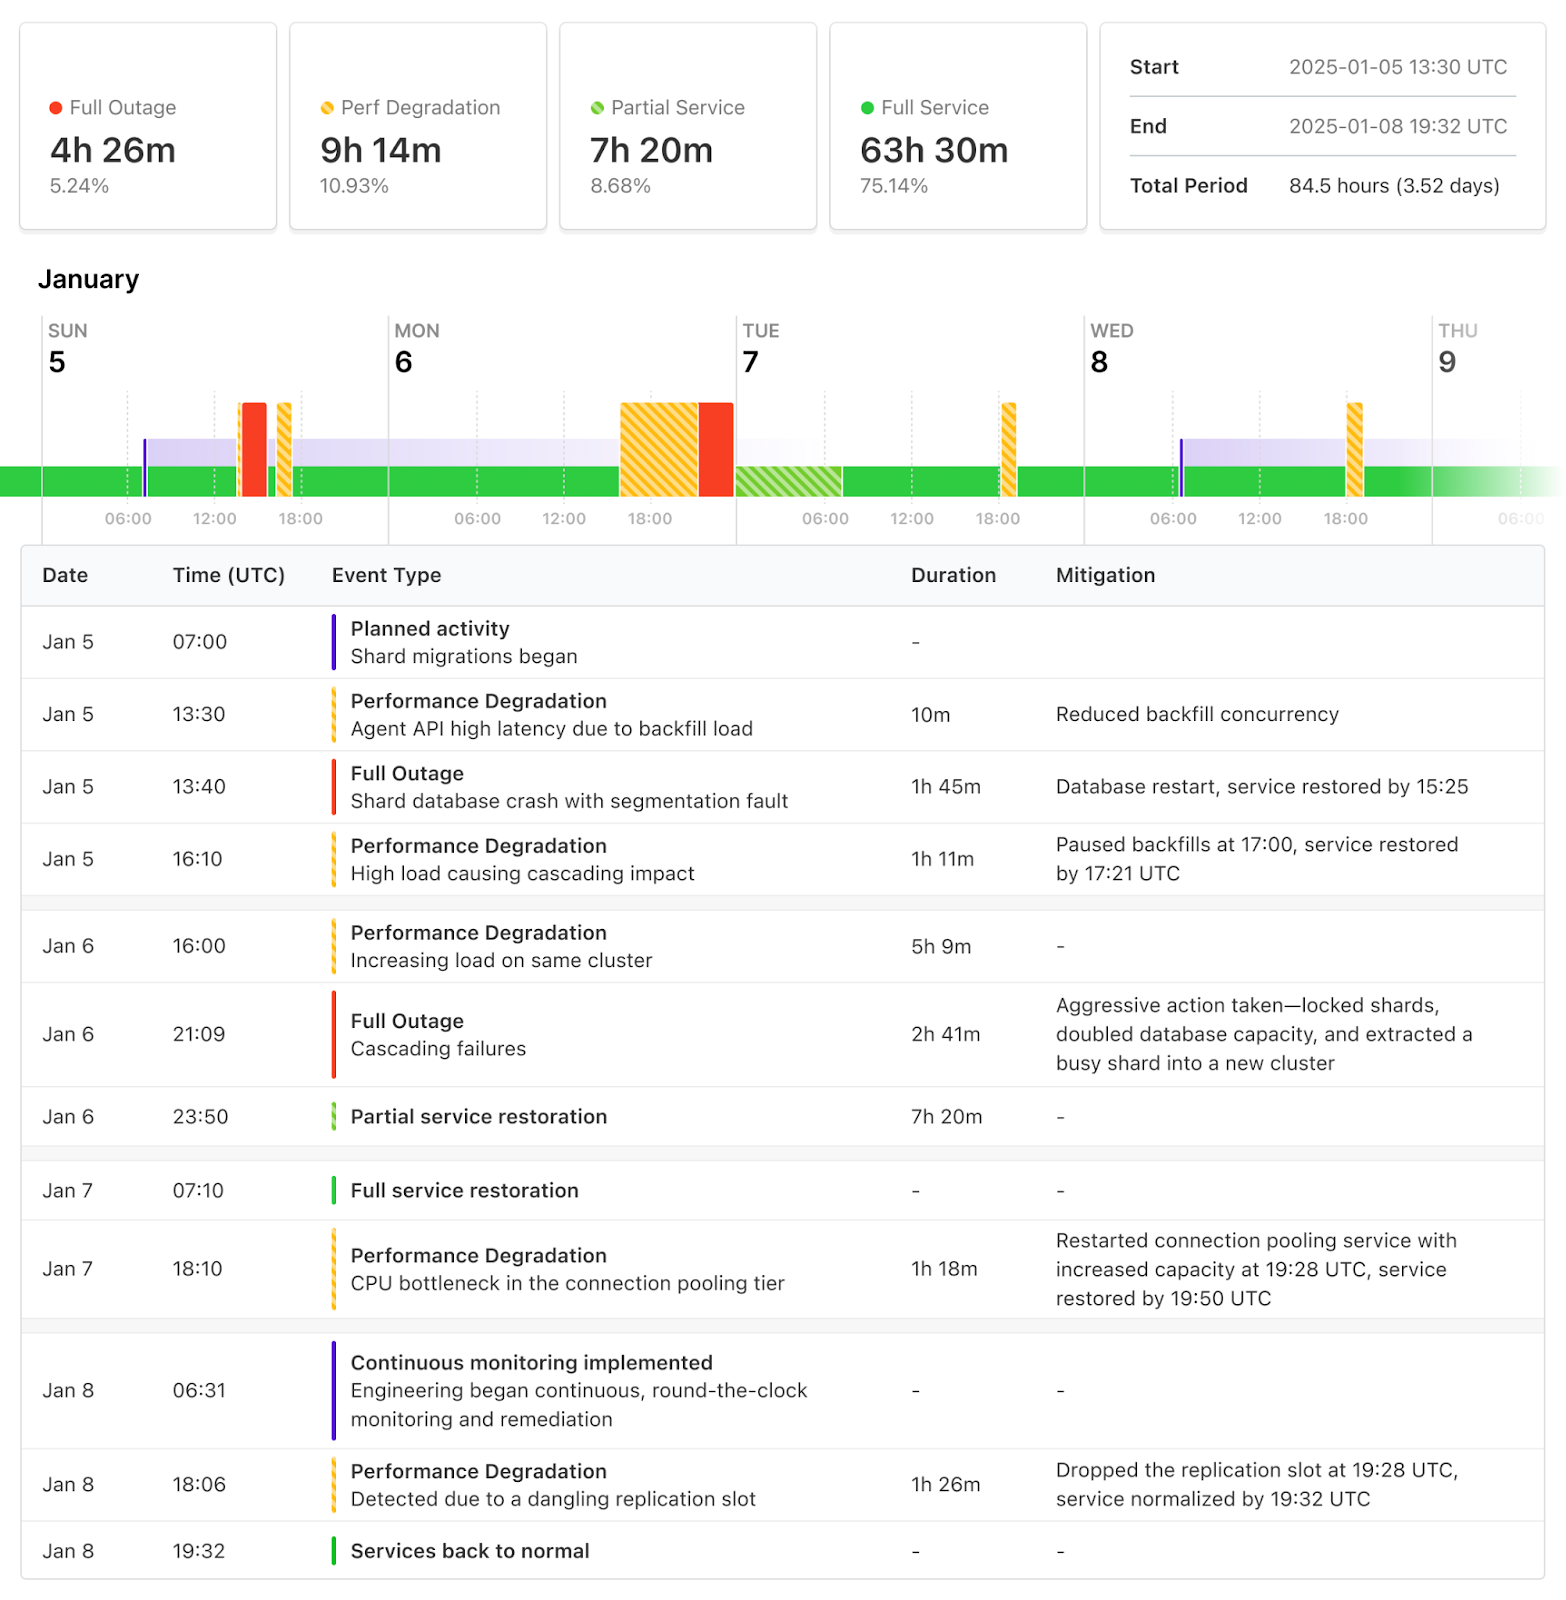 ### Background Buildkite has grown significantly and over the last two years, we have been working to increase the capacity and reliability of Buildkite Pipelines. Our original database was reaching the maximum capacity supported by our cloud provider, and so we introduced horizontal sharding. In **Q1 2023**, core database tables were extracted from our monolithic database. In **Q2 and Q3 2023**, horizontal sharding was implemented. We now operate **19 shards across 7 databases**. In early 2024, we successfully migrated our largest customers off this original database, which reduced load on that database by over 50%. In late 2024, we [began the process of migrating all customers](https://buildkite.com/docs/pipelines/announcements/database-migration) remaining on this original shard with customer chosen migration slots running from **2024-12-15** to the final slot currently available on **2025-03-02**. ### Migrations started On **Sunday 2025-01-05**, the latest batch of shard migrations began as expected at **07:00 UTC**. The initial phase of a migration is to lock each customer workload, move the core models and recent history to the new shard, then unlock it. This first phase finished successfully at **08:00 UTC** and those customers began operating successfully from their new shard. The next phase was to backfill historical records. This second phase began as expected. ### Migrations cause performance degradation leading to outage On **Sunday 2025-01-05 at 13:30 UTC** performance started degrading on the Agent API leading to high request latency. We were alerted that latency was becoming unacceptable at **13:45 UTC**. Investigation revealed that the migration backfill was causing higher load on the target shard than any previous migration. This high load on one shard subsequently cascaded into connection exhaustion in our database pooling tier and thread pool exhaustion in our Agent API’s application tier, the latter of which led to impact across all shards. We reduced the concurrency of the backfill to reduce load and restore performance. At **14:24 UTC**, the underlying database for the target shard experienced a segmentation fault and restarted. This caused a total outage for the affected shard, and some operations that cross shards may have had errors depending on whether they reached the affected shard. We are still actively investigating this segfault with our cloud provider. Once the database returned, it returned healthy, and service was restored by **15:25 UTC**. We continued monitoring. At **16:10 UTC** we observed high load again. The same cascading behaviour eventually caused global impact, leading to outage for all customers. We entirely paused the backfills at **17:00 UTC** to restore service by **17:21 UTC**. Remaining backfills have since been resumed at lower concurrency and monitored through to completion without impact. The backfill process has also been adjusted to respect database load as backpressure, to ensure backfills will never overwhelm a database under load. ### Performance degradation, leading to outage On **Monday 2025-01-06 at 16:00 UTC**, we started experiencing high load which turned into performance degradation causing an alert at **16:37 UTC**. The same underlying database cluster seemed to be a bottleneck. Between **16:37 and 23:00 UTC** engineers worked to identify troublesome workloads and implement load shedding to restore service. It was not clear that the migrations were a root cause at this time. The workloads driving the load appeared to be on a different shard. But the same cascading effects were observed with slowly increasing impact. At **21:09 UTC** the cascading effects resulted in a service outage. ### Capacity increased, service restored At **23:00 UTC** a decision was made to take more drastic action. The shards driving load were entirely locked, and customers on these shards experienced total outage. The underlying database was upgraded to double its size. And one of the busiest shards on that database was extracted into its own new database cluster. By **2025-01-07 01:05 UTC** we were seeing partial restoration, progressively restoring access by customer. By **07:10 UTC** service was fully restored. Our problematic database cluster now had twice the capacity for 3/4 shards. ### Performance degradation, leading to outage On **Wednesday 2025-01-07 at 18:10 UTC**, we once again started experiencing performance degradation. Investigation revealed that database load was nominal but there was a CPU utilization plateau in the database connection pooling tier. This bottleneck led to degraded performance for all customers eventually leading to high error rates and outage. ### Capacity increased, service restored At **19:28 UTC** the database connection pooling service was restarted with greater capacity. Once available, restored workloads again caused high load on the database cluster causing performance degradation which led to an outage. Load shedding restored degraded performance, yielding in service restoration by **19:50 UTC**. We also found that the database struggling with load was seeing 3-4x more load than any other database at peak load. This clue led us to finding that the database connection pooling layer was limiting connections to the database per shard instead of per cluster, but connections are a cluster wide resource. We know that our databases are healthy at a certain level of concurrency but start thrashing when given too many active connections simultaneously. Our current database connection pooling architecture makes it difficult for us to implement these concurrency limits at the cluster level. But the additional capacity added to the problematic database cluster combined with extracting one shard into an additional cluster has given us enough capacity to handle peak load during regular operations while we work on improving our database connection pooling architecture to add concurrency constraints. On **Wednesday, 2025-01-08** **06:31 UTC** our engineering team began constant, round the clock shifts to minimise customer impact, actively monitor, and be ready to remediate. ### Performance degradation On **Wednesday, 2025-01-08 at 18:06 UTC** we observed performance degradation due to the same database. Measures put in place to isolate the impact from that database across the service combined with load shedding efforts kept the service available. The source of the degradation is traced to a dangling replication slot left behind during the setup of the new cluster on 2025-01-06. ### Replication slot cleaned up, performance restored At **19:28 UTC** the dangling replication slot was dropped. By **19:32 UTC**, performance returned to normal. Due to our haste in configuring the new database, our usual monitor for replication slot lag contained a mistake, so we were not alerted to this issue in a timely manner. This mistake has been corrected, and our usual runbooks and modules for provisioning databases do not contain this mistake. # Next Steps Throughout the incident and in its aftermath, extensive efforts were undertaken to identify the root causes of high load and implement performance improvements. While not every investigative path directly addressed the immediate issues, many revealed previously unexposed bottlenecks within our infrastructure - areas that have not yet been stressed but could have caused future disruptions. These discoveries have been invaluable, and we are now proactively resolving these vulnerabilities to strengthen our systems and prevent similar incidents moving forward. We have learned a great deal during this period, and while it’s not possible to capture every learning or action taken or planned in a single narrative, the following key efforts are being pursued: ### Seasonal Load Given the confidence gained by initial load testing and the migrations already performed over the past year, we wanted to allow customers to take advantage of their seasonal low periods to perform shard migrations, as a win-win. This caused us to discount the risk of performing migrations during a seasonal low period and what impacts might emerge when regular peak traffic returned. Our usual approach to these sorts of things is to be “careful yet relentless.” We like to make small changes and incrementally roll them out, observing their behaviour and impact at peak loads. In this case we may have been overconfident, and this is a reminder to take smaller, more frequent steps and always evaluate changes under peak loads. ### Database shard planning We’ve reduced the amount of shards we allow in a database cluster. Smaller steps when changing shard distribution strategies are required to prevent unexpected impacts. Future database shard and cluster architectural changes will be made more incrementally. ### Database pooling architecture Several times when reconfiguring our databases and database connection pools we needed to deploy changes to our database connection pooling tier. These deploys took longer than expected, and often caused momentary downtime when performed at peak load. We are evolving our database connection pooling architecture so that we can make zero-downtime changes with faster feedback. Our current architecture also doesn’t allow us to implement cluster-level connection limits. We are working on this problem so that we can introduce better bulkheading and concurrency limits to prevent overwhelming our databases at peak load in future. ### Shard isolation When introducing sharding we were able to add shard selection and routing into most functionality across Buildkite Pipelines. But some key transactions do not contain enough information to route directly to the correct shard without modification or additional functionality. For example, new agents register with Buildkite using an agent registration token. This token does not contain any information about which organization it belongs to nor which shard it should ultimately be routed toward. To solve this we query each shard until the correct shard is determined and cache the result. While effective under normal conditions, this approach became a point of failure when a single shard experienced issues, leading to broader service disruptions. Several opportunities to avoid cross shard queries and improve cache hit rates were revealed during the incident. Transactions are being enhanced to embed detailed routing data upfront, such as customer specific endpoints, to ensure requests are routed directly to the correct shard. Improved caching strategies are being employed to increase cache hit ratios when direct routing isn’t feasible. ### Shard-aligned infrastructure Our background worker infrastructure, which powers Buildkite Pipelines, had already been modified to leverage database sharding. Each shard operates with distinct queues and dedicated capacity. This allowed effective observation of workloads per shard and enabled key load shedding efforts. This design has been instrumental in maintaining system stability and performance over the past 6 months. Extending shard-aligned infrastructure to all layers was already planned. During incident response we successfully deployed a shard-isolated Agent API tier to contain the impact and protect unaffected workloads. We will continue to expand this model, establishing stronger bulkheading between customer workloads across different shards. # Finally We sincerely apologize for the disruption and inconvenience this series of outages caused. We understand how critical our services are to your operations, and we deeply regret the impact this had on your workflows. Please know that we are fully committed to learning from this incident and have taken immediate and long-term actions to strengthen our infrastructure. Thank you for your continued trust and support as we work to deliver a more resilient and reliable Buildkite experience.
We have completed our mitigation efforts, and have seen a full restoration of service for all users. Our monitoring shows that all customers are now operational and processing normally.
The fix has been rolled out and all customers should now see recovery. We will continue to monitor.
The majority of customers are now operational and processing normally. Remaining customers experiencing issues are having targeted mitigations applied.
The majority of customers are now operational and processing normally. Remaining customers experiencing issues are having targeted mitigations applied.
We continue to see the majority of customers see improvements as jobs are picked up and ran. We are implementing a further mitigation for the remaining impacted customers.
We continue to see the majority of customers see improvements as jobs are picked up and ran. We are investigating means to expand these mitigations to all customers.
We are continuing to see a restoration of services for the majority of our customers.
We’re seeing a partial restoration of services for majority of our customers.
We are still experiencing significant performance degradation to a database cluster. We are performing targeted load shedding to help restore service to broader customer base, before bringing the specific customers online.
We are still experiencing significant database degradation due to load. We are investigating multiple paths to try and resolve the issue.
We are currently experiencing significant database degradation and are continuing to investigate the issue.
The fix rolled out fixed the notification latency but we have run into another issue during this mitigation which the team is actively investigating.
We've identified the cause of delayed notification delivery, a fix is in place and notification latency is recovering
We identified the possible root cause of the issue and are actively working on mitigating the issue
We are currently experiencing degraded performance due to a recurrence of recent database performance issues. Our engineering team is actively investigating and working on mitigating the impact
We are continuing to investigate this issue
We are currently investigating this issue.
Report: "Increased error rate in Agent API"
Last updateThis was part of a wider incident and the full write up is available here: [https://www.buildkitestatus.com/incidents/txxkzf4r262c](https://www.buildkitestatus.com/incidents/txxkzf4r262c)
This incident has been resolved.
We've identified the root cause of the degraded performance on one of our database clusters. System performance has returned to normal. We continue to monitor for any changes.
We are currently investigating this issue.
We continue to investigate the root cause of performance issues on one of our database clusters.
We are experiencing further issues with degraded performance on the Agent API.
We continue to monitor the performance of the Agent API.
Agent API has returned to normal performance. We continue to investigate the root cause.
We've identified that the increased error rate is isolated to a single database shard with reduced impact. We continue to investigate the root cause.
We continue to investigate the root cause of the increased error rate and latency in the Agent API.
Errors rate has increased. We continue to investigate the root cause.
Service status has returned to normal. We continue to investigate the root cause.
We're experiencing an increased error rate in the Agent API and are investigating the cause and impact.
Report: "API performance degredation"
Last updateThis was part of a wider incident and the full write up is available here: [https://www.buildkitestatus.com/incidents/txxkzf4r262c](https://www.buildkitestatus.com/incidents/txxkzf4r262c)
This incident has been resolved.
Load has returned to normal levels after mitigations were put in place. We will continue to monitor the situation for any further impact.
We are seeing degraded performance across web and API due to a re-occurance of recent database performance issues. We are actively mitigating the problem.
Report: "Elevated response time in the Agent API"
Last updateThis was part of a wider incident and the full write up is available here: [https://www.buildkitestatus.com/incidents/txxkzf4r262c](https://www.buildkitestatus.com/incidents/txxkzf4r262c)
Incident is resolved as we no longer see elevated latency issues after applying the necessary mitigations.
We are observing latency is returning to normal levels after the mitigation and we are actively monitoring it.
We applied some mitigations and are observing improvements in the elevated latency but continuing to investigate this further.
We are seeing elevated latency with Agent API and team is investigating the issue.
We've spotted that something has gone wrong. We're currently investigating the issue, and will provide an update soon.
Report: "Increased error rate delivering Build email notifications"
Last updateThis incident has been resolved.
We are experiencing an increased error rate with our upstream provider when delivering Build email notifications. We are switching to our backup provider.
Report: "Hosted Agents - Scheduling Issues"
Last updateThe released fix has resolved the issue, and we are now seeing hosted jobs successfully dispatched as expected.
A fix for the dispatch of hosted jobs has been released, which has unblocked the queue of work. Some further latency may occur as this queue is processed.
We have identified a network connectivity issue preventing the dispatch of jobs to hosted agents. We are continuing to work to mitigate the issue.
We have identified a scheduling issue and mitigating the impact of unavailability of Hosted Agents. We are currently seeing increased queue time for jobs at the moment.
Report: "Increase latency and error rates for API requests"
Last updateWhile rolling out a change to test a new version of Rails on a small percentage of traffic, some web services were not scaled sufficiently to meet demand. This resulted in a 15 minute period where services did not have sufficient capacity.
We have identified and rectified an issue with scaling of our API web servers and continue to monitor
We've identified increased latency and error rates on all API requests (REST, GraphQL, Agent API)
Report: "Issue uploading artifacts"
Last update## **Service Impact** From 00:49 to 01:26 on Nov 15, 2024 \(UTC\), an estimated 1% of artifacts failed to upload due to signature verification errors. ## **Incident Summary** Up to 1% of build artifact uploads, principally those uploaded by Agent version v3.83.0 or later, encountered signature mismatch errors. This Agent version introduced multipart uploads. A backward-incompatible server library upgrade instigated the incident. Seven minutes after the incident was detected, we rolled back the change. The root cause was a recent upgrade of Ruby library dependencies responsible for URL presigning. One library added an additional header for all REST API calls, a change not accounted for in the older version of a related library which we did not upgrade at the same time. This omission led to the URL signature mismatch errors on upload. ## **Changes we're making** In future, we’ve ensured that this group of libraries is upgraded as a whole to prevent dependency mismatches that could introduce unintentional breaking changes. Additionally, we will enhance our test coverage around presigned URLs to ensure that their signatures match the expectations of our upload service, and improve monitoring of the upload completion rate to reduce detection time.
This incident has been resolved.
Up to 10% of artifacts failed to upload due to a signature verification error. We have rolled back to a known good version while we investigate further.
We are continuing to investigate this issue.
We are investigating issues uploading artifacts from the Agent.
Report: "Hosted Agents - Scheduling Issues"
Last updateThis incident has been resolved.
We are seeing recovery of the queue times back to expected levels and monitoring the situation.
We have added more capacity and are observing recovery. Some Builds might still observe slightly longer queuing time, but the queue time is improving.
We are currently working on adding additional compute capacity but still seeing degraded performance and increased queue times.
We have identified a scheduling issue and mitigating the impact of unavailability of some Hosted Agents instance types. We are currently seeing increased queue time for jobs at the moment.
Report: "Elevated error rates"
Last update## Service Impact At 03:27 on November 12th UTC our Redis cache cluster experienced a failover during routine maintenance. This resulted in the writer node becoming unavailable, and the replica node was automatically promoted as the new writer. This caused an error spike, peaking at 70% of HTTP requests returning errors at 03:48 UTC before rapidly falling until recovery at 03:54. During the error spike requests to our Web interface and APIs experienced errors and some Jobs experienced delays in being assigned to Agents of up to several minutes. ## Incident Summary * 03:26 UTC we applied routine maintenance to our Redis cluster. This would normally result in little or no downtime however, for reasons as yet unknown, our application did not handle the event gracefully. * 03:31 We declared an incident due to a small, but definite increase in errors communicating to Redis. * 03:48 The error rate began to rapidly spike. * 03:49 We canceled the queued maintenance on other Redis clusters. * 03:54 The error rate rapidly returned to a baseline and we started seeing recovery. * 03:55 As an additional precaution, we restarted our application to ensure all connections were updated to the new writer node. * 04:17 The incident was marked as resolved. ## Changes we're making We are investigating what caused our application to not failover to the new writer node as expected. Previously we had upgraded our client library to fix [a bug with failovers when using AWS ElastiCache](https://github.com/redis/redis-rb/issues/550), but this incident indicates there is still work to do to ensure routine maintenance causes minimal impact to our systems. We will also be updating our Redis cluster upgrade process to include a review of relevant Redis client updates.
The issue is now fixed. This incident has been resolved.
The fix has been deployed. We are now monitoring the issue.
We are investigating elevated error rates across our services.
Report: "Errors when creating Artifacts"
Last update## **Service impact** Jobs running on v3.83.0 or v3.83.1 of the Agent could not create artifacts for 25 minutes. ## **Incident summary** Beginning at 2024-10-17 05:02 UTC, a change was deployed to Agent API which was intended to prevent older versions of the Buildkite Agent that are incompatible with a [soon-to-be-released feature](https://github.com/buildkite/agent/pull/2991) from using that feature. The change contained a bug which impacted versions 3.83.0 and 3.83.1 of the agent, which passed through our CI process due to a gap in integration specs in an older part of our code base The team responsible for the change was monitoring the deployment, noticed the errors immediately and started our incident response process. Together with our on-call engineers, they triggered an emergency rollback to a known working commit. The emergency rollback finished at 2024-10-17 05:27 and service was restored. We then deployed a revert of the broken change to ensure we did not return to a broken state. ## **Changes we’re making** We have since shipped an improved version of the code change with additional test coverage, including deeper integration tests covering the edge case that was missed. ## **Appendix - Supporting materials** 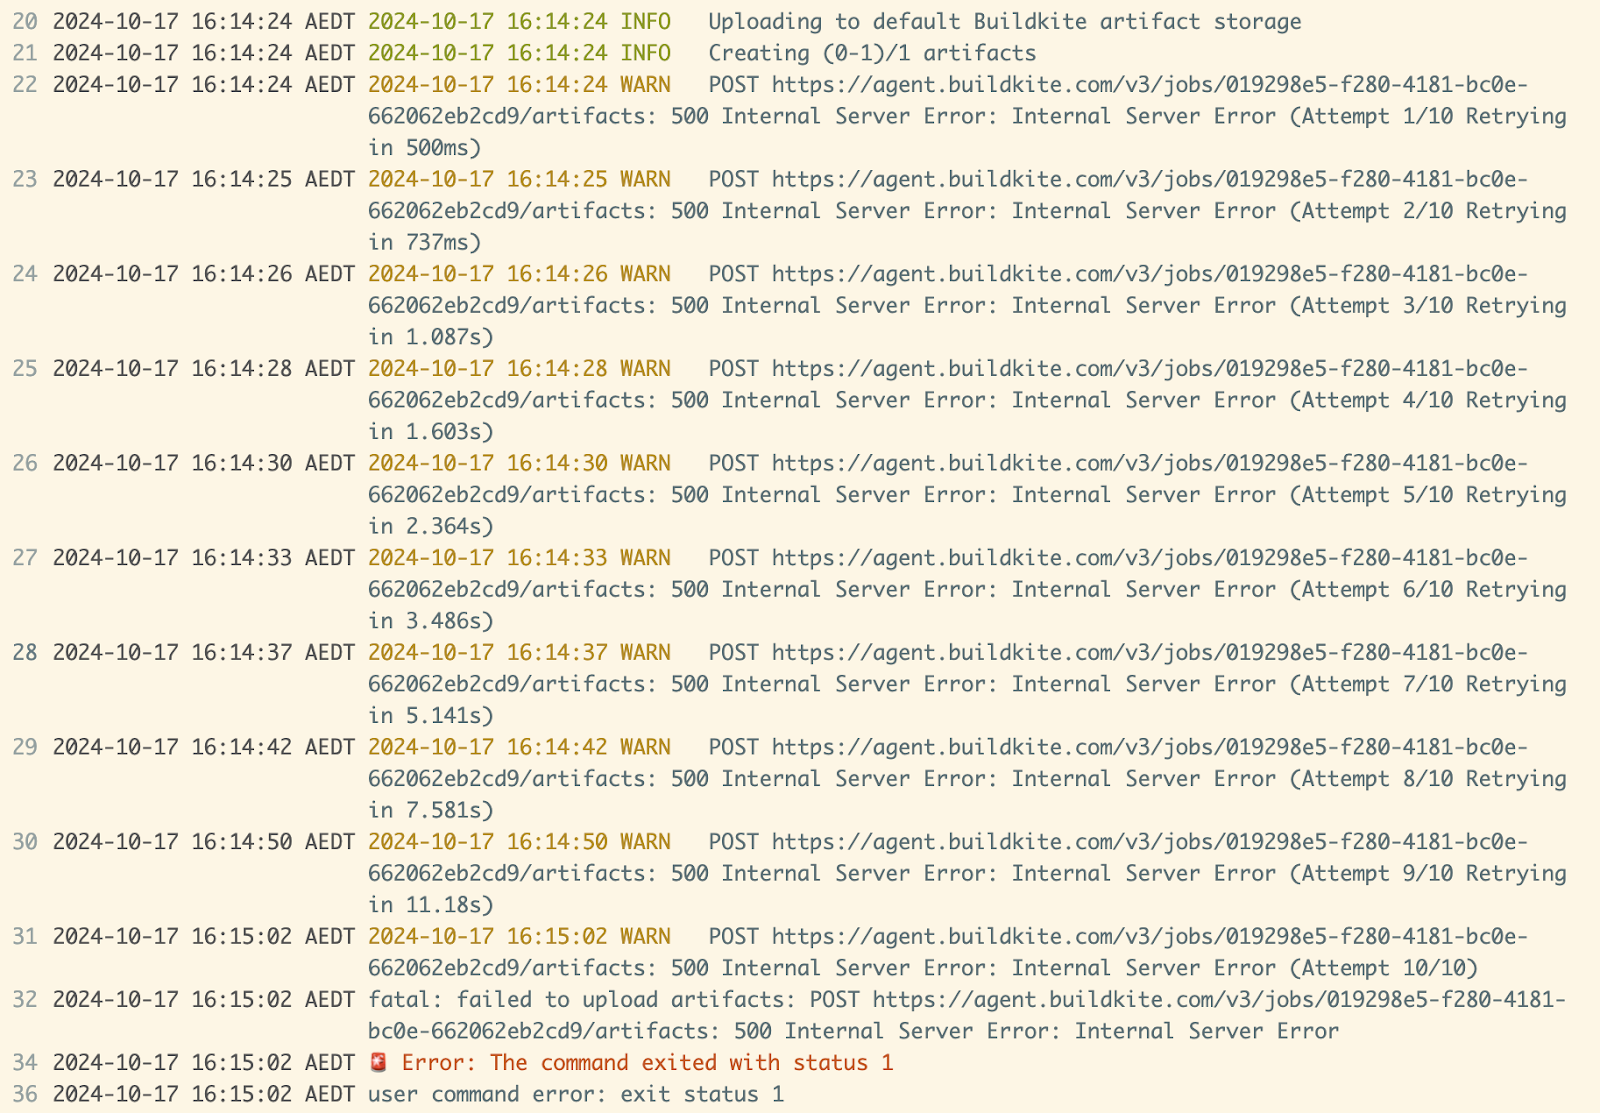 Example of the artifact upload failure in a job log
This incident has been resolved.
The affected service has been reverted to a known good version. We are monitoring the impact.
A recent deploy has introduced an error when creating build artifacts. We are reverting to a known good version.
Report: "Increased queue times on Hosted Agents"
Last updateThis incident has been resolved.
Our provider has applied a remediation to the issue and we are monitoring and seeing recovery on Hosted Agents
Our provider has identified an issue causing increased queue times on Hosted Agents, and are working on a remediation.
Report: "Elevated error rate on build creation"
Last updateA change to our database permissions caused creation of new builds to fail for some customers. Affected customers trying to create new builds via the API would have received a 500 error. Builds created via webhook (e.g. from Github), trigger steps or scheduled builds were delayed by up to 8 minutes.
We have deployed a mitigation to fix the issue, and are now monitoring. During the period of higher error rates, builds created via API may have failed outright. Builds created via webhooks, triggers or schedules are retried, though there may be some latency in processing these now due to retry back-off.
Our monitoring has detected an elevated error rate in creating builds. We're currently investigating the issue, and will provide an update soon.
Report: "Elevated Agent connectivity issues"
Last update## Service Impact **Database performance degradation \(all customers\):** Between August 22nd and August 29th we saw periods of degraded performance of our database due to increased lock contention. This resulted in: * An increase in our API error rate \(up to 0.6%\) for brief periods of time. * A small number of jobs \(less than 50\) took up to 5 minutes to be dispatched to an agent. * A small number of pipeline uploads failed causing their build to fail. **Agent lost bug \(some customers\):** Customers running agent version v3.76.0 to v3.82.0 \(inclusive\) on Linux were impacted by a bug in the way HTTP/2 connections handle connection timeouts. This was [fixed in v3.82.1](https://github.com/buildkite/agent/pull/3005) of the agent. We estimate 131,500 jobs failed due to agents being unable to communicate with the Buildkite backend. 93% of these jobs were [automatically retried](https://buildkite.com/docs/pipelines/command-step#retry-attributes-automatic-retry-attributes). ## Incident Summary On the 31st of July 2024 we released a new version of the Buildkite Agent \(v3.76.0\) which fixed a bug in how we configured our HTTP communications to the Buildkite API. Previously almost all agent communications to Buildkite used HTTP/1.1.This unmasked a [bug in the Golang standard library](https://github.com/golang/go/issues/59690) in how HTTP/2 connections are re-used resulting in an intermittent issue with agents losing connectivity to Buildkite backend for many minutes. Because this issue only manifested when a network connection stopped receiving any packets from our API, which is known to occur when stateful network appliances such as NAT Gateways and Firewalls drop the connection without notifying the client, this issue went unnoticed for some time. **Database performance degradation** The impact of this bug first manifested as increased locking on one of our databases, due to the increase in agents transitioning to a “lost” state and back to “connected” and how our database schema handles that. PostgreSQL has a global limit of locks, which is a multiple of the maximum number of connections; in this specific database the limit was around 100,000. When this limit is reached the server returns an OutOfMemory error to each running transaction, then returns to normal behaviour. This resulted in increased errors on our API and a small number of Builds being delayed or failing. We resolved this issue on August 29th by decreasing the number of locks necessary for some queries. In particular this query was behaving unexpectedly: `UPDATE builds_partitioned SET state = $1, started_at = $2 WHERE id IN (` ` SELECT id FROM builds_partitioned WHERE id = $3 AND state = $4 FOR UPDATE` `) RETURNING state` Because the table we’re updating is partitioned we need to ensure all queries use the partition key to ensure an efficient query with minimal lock contention. This query uses the `id` column, which is the partition key for this table. But because of the nested query the Postgres query planner isn’t able to know which partitions to prune for the outer query, so it scans each partition, requiring [lightweight locks](https://pganalyze.com/blog/5mins-postgres-lock-monitoring-lwlock-log-lock-waits) to be taken out on each partition and its indexes. This can result in a single query taking out more than 1,500 lightweight locks. Because this query only needed to update a single row we could change it to: `UPDATE builds_partitioned SET state = $1, started_at = $2 WHERE id = $3 RETURNING state` Which reduced the number of locks this query required dramatically. Because the lock limit is global to the entire database, our reduction in locks from this query mitigated the OutOfMemory issue, even though it was triggered by the HTTP/2 change described above. **Agent lost investigation** Around late August we started to receive customer reports of job failures due to lost agents. When our backend doesn’t receive any communications from an Agent for more than 3 minutes it’s marked as lost and any jobs it’s running are cancelled. This can be caused by a variety of reasons, including: * Network partitions caused by third party connectivity issues * NAT port exhaustion on the Virtual Private Cloud where agents are running * Agent process being terminated by Linux OOM process After eliminating these possibilities we attempted unsuccessfully to replicate the issue locally. In order to gather more information we released a new version of the agent which would [emit logs](https://github.com/buildkite/agent/pull/2989) about the connection timings and state when a timeout occurred. While waiting to receive this information one of our engineers found a [blog post ](https://www.bentasker.co.uk/posts/blog/software-development/golang-net-http-net-http-2-does-not-reliably-close-failed-connections-allowing-attempted-reuse.html)that described the behaviour we had observed. Despite following the reproduction steps we couldn’t replicate the behaviour with the test code provided on our MacOS development environments. Only once we switched to Linux were we able to replicate the problem. On the 23rd of September we [released a new agent version](https://github.com/buildkite/agent/pull/3005) which mitigated the issue by setting [the recommended workaround](https://github.com/golang/go/issues/59690#issuecomment-1733619488). Following further validation on September 25th we began notifying customers using the impacted versions they should upgrade their agent. Two weeks after the new agent version was released, more than 20% of agents were using v3.82.1, compared to 7.2% using the impacted versions. The number of reconnection events per agent confirmed our bug fix had the desired effect \(lower is better\).  ## Changes we're making We’re continuing to reduce the size of our databases via horizontal sharding, to further decrease the risk of lock contention such as we saw in this incident. We have improved our reporting and visibility into the number of agents lost, to enable us to identify and resolve potential future regressions faster.
Customers running agent version v3.76.0 to v3.82.0 (inclusive) on Linux were impacted by a bug in the way HTTP/2 connections handle connection timeouts. This was fixed in v3.82.1 of the agent. We estimate 131,500 jobs failed due to agents being unable to communicate with the Buildkite backend. 93% of these jobs were automatically retried.
Report: "Hosted Agents Unavailable"
Last updateWe have identified an issue with the database server backing hosted agents and deployed a mitigation. Services are operating normally.
Hosted Agents are unavailable. New jobs will not be started and existing jobs may be impacted.
Report: "Slow response time on Artifact uploads"
Last updateWe've seen no further impact for 20 minutes
We've mitigated the issue and will continue to monitor. We've implemented a preventative measure to prevent this runaway query from happening again.
We've identified a problem runaway query and are working to mitigate it
We're experiencing high load on a database that is causing increased latency
Report: "Agents unable to register, disconnect, or update state"
Last updateFor an 11 minute period the Buildkite Agent API was unable to process requests for new agents to register, disconnect, or update state. Existing, registered agents were still able to be assigned new Jobs and process them. Agents automatically retry connection attempts, meaning agents should have all connected as normal by the time the disruption passed.
Report: "Degraded in Build page UI"
Last updateThis incident it's resolved
We've spotted that something has gone wrong. We're currently investigating the issue, and will provide an update soon.
We're getting reports of degraded performance in the Build page UI. We are investigating the root cause and will continue to provide updates throughout.
Report: "Degraded Perfomance - Artifacts"
Last updateThis incident has been resolved.
We have identified the issue and rolled back a feature flag and monitoring the situation.
We are currently investigating reports of issues with downloading Artifacts using Agents.
Report: "Elevated error rate and latency in Agent API"
Last update## Service Impact Elevated error rate and elevated latency when creating, retrieving, or updating artifacts in the Agent API, REST or GraphQL APIs, or web interface. ## Incident Summary We store metadata for all uploaded artifacts in a managed RDS PostgreSQL database. Beginning from around 18:55 UTC, the performance of queries to that database degraded due to a hardware failure, and it started to fail over to its replica at 19:02 UTC, finishing at 19:06 UTC. It then took until 19:14 to catch up on the transaction log. Hardware issues and failovers are expected, however performance was still unexpectedly poor. We discovered that due to an unclean shutdown, all statistics counters were reset, resulting in very inefficient query plans. At 19:47 we manually ran an ANALYZE command and query performance was restored to normal levels. ## Changes we're making We have since switched artifact metadata storage to a partitioned table, such that each partition only stores a few days worth of data. As well as improving day-to-day query performance, we expect this will improve time to recovery after any future failover. We have also updated our runsheet for a database failover to ensure statistics are regenerated.
Latency and error rates of the Agent API have recovered after a database failover.
Latency of the Agent API has recovered after a database failover, we are continuing to monitor performance after this change.
We are continuing to investigate the root cause for the spikes in latency with Agent API
Latency of Agent API is back to normal. We are continuing to investigate the root cause of the issue
We've detected a higher than normal latency and error rate in our Agent API, we are investigating.
Report: "High error rates and timeouts in the Agent and Rest APIs"
Last updateThis incident has been resolved.
We are continuing to monitor for any further issues.
We are continuing to monitor for any further issues.
We have identified the source of high load and put service protections in place to reduce the impact. The Agent and Rest APIs are now performing nominally. We continue to monitor service performance.
We are experiencing degraded database performance which is causing high latency and timeouts on the Agent and Rest APIs. We continue to investigate the root cause. We will provide another update in 30 minutes.
We are experiencing a high concurrence of Builds which is causing increased latency and timeouts on the Agent and Rest APIs. We continue to investigate the root cause. We will provide another update in 15 minutes.
We've spotted an issue with our Agent and Rest APIs. We're currently investigating the issue, and will provide an update soon.
Report: "Partial outage of hosted agents"
Last updateThis incident has been resolved.
Hosted agents have now recovered and we expect the system to be operating normally.
We are seeing early recovery of Linux AMD and Mac OS instances. We continue to remediate a partial outage of Linux ARM compute resources. Docker building remains impacted by this partial outage.
We are investigating a partial outage of hosted agent compute resources.
Report: "Delayed events to GitHub"
Last updateGithub have indicated they've resolve the networking issue and we have seen notifications latency return to normal.
Github have rerouted traffic and we are seeing latency return to normal levels
A small percentage of notifications to Github (~10%) continue to be delayed by 30-600 seconds. We're continuing to work with AWS and Github to identify and resolve this issue The next update will be in 1 hour unless more information is available.
Degraded network connectivity between one of our availability zones and GitHub is causing a subset of events to be delayed by up to several minutes.
Report: "Builds stuck"
Last updateWe have reprocessed the stuck builds, which has resolved the issue.
Status page update will say: We’ve identified a problem which is causing some customer builds to get stuck. We are working to automatically process those builds and will provide an update shortly
Report: "Elevated request latency & timeouts on HTTP services"
Last updateA configuration error led to our HTTP compute capacity being briefly under-provisioned. This led to some requests seeing elevated response times, and some timeouts.
Report: "Notification delivery delays"
Last updateWe've identified this as a known issue, and can confirm there is no ongoing impact. We will continue to work on a more permanent fix for this issue.
We've observed delays in delivering build status notifications and are investigating.
Report: "Degraded Performance"
Last updateThis incident has been resolved, performance has returned to expected levels.
We saw an increased amount of load, resulting in the degraded performance. This has now cleared but we are continuing to monitor the situation.
We are experiencing poor performance across the application and are investigating.
Report: "Delayed notifications"
Last updateBuild and job notifications such as commit statuses and outgoing webhook notifications have returned to normal operation.
Delays to build and job notifications such as commit statuses and outgoing webhook notifications are recovering, we are continuing to monitor the improvement.
We are continuing to investigate delays to build and job notifications such as commit statuses and outgoing webhook notifications.
We are investigating delays to build and job notifications such as commit statuses and outgoing webhook notifications.
Report: "Delayed dispatch"
Last updateJob dispatch has recovered and remained stable for over 2 hours.
The delays have subsided and we're currently monitoring our job dispatch times.
We are investigating delays to job processing
Report: "GitHub commit statuses are failing to be dispatched"
Last updateWe've successfully rolled back the recently deployed change that is causing GitHub commit statuses to fail for repositories that are connected with our GitHub App. All failed statuses have entered our retry queue and will be sent out shortly.
We've rolled back the recently deployed change that is causing GitHub commit statuses to fail for repositories that are connected with our GitHub App. All failed statuses have entered our retry queue and should be sent soon.
We're continuing the reversion of a recently deployed change that is causing GitHub commit statuses to fail for repositories that are connected with our GitHub App. All failed statuses have entered our retry queue and should be sent after the fix has been deployed.
We have identified an error in a recently deployed change that is causing GitHub commit statuses fail for repositories that are connected with our GitHub App. We are reverting the change. All failed statuses have entered our retry queue and should be sent after the fix has been deployed.
We are currently investigating an issue in which GitHub commit statuses are failing to be dispatched.
Report: "Degraded Performance"
Last updateWe have successfully disabled the job causing load issues. we have also identified and mitigated a seperate database performance problem that we believe contributed to this incident.
We have identified a specific background job that results in excessive database load. Currently we have paused all background jobs while we deploy a change to disable just the problematic job.
We've implemented a mitigation and have seen performance improve and are continuing our investigation into the cause
We are experiencing poor performance across the application and are investigating.
Report: "Degraded Notification"
Last updateLatency for notifications has returned to normal operation.
We're still experiencing a small increase in latency for notifications and are actively investigating the root cause.
We're still actively investigating latency to notifications. We have noticed performance has improved slightly, but we are still investigating.
We are currently investigating a delay in service notification processing
Report: "Elevated Latency"
Last update## Service Impact On 2024-01-26 between 17:09 and 19:31 UTC, our Agent APIs experienced increased latency. Two small spikes in error rates were also seen at 17:32 and 19:15 UTC. Customers may have experienced delayed job dispatch during this period. A small number of customers using legacy versions of buildkite-agent-metrics also experienced timeouts when fetching metrics. Due to recent database reliability improvements the impact was contained to a subset of customers. ## Incident Summary Our monitoring detected elevated response times on the Agent API and investigation revealed that a REST API endpoint used by legacy versions of buildkite-agent-metrics was also experiencing timeouts. After some time it was concluded that the requests from the legacy versions of buildkite-agent-metrics were driving the high load on the database and changes were made to temporarily block these requests. This had the immediate effect of reducing load on the database and Agent API latency restored to normal levels. Further investigation has identified that a VACUUM on one table partition led to the PostgreSQL query planner using a more expensive lookup algorithm. Our legacy metrics queries then chose this very expensive alternative query plan that overwhelmed the database. Subsequent testing has confirmed that an ANALYZE on the affected partition resolves the performance degradation immediately. ## Changes we’re making **Update:** As of 2024-01-30 11:00 UTC we have eliminated the bloat in the problem partition and it is no longer an ongoing concern. **Previously:** The table partition in question is one of our oldest and suffers from significant bloat. This partition is almost empty and we are working towards eliminating it completely as soon as possible. Doing so will avoid the risk of the bad query planning re-emerging. In the meantime our on-call engineers are prepared to run an ANALYZE on the partition should it go bad again, and we are looking at changes to our monitoring to try and detect this condition earlier. We will also be reaching out to the few remaining customers who use legacy versions of buildkite-agent-metrics \(versions earlier than v3.0.0\) to encourage them to upgrade to newer versions. We will be dropping support for these versions in the near future.
This incident has been resolved.
A fix has been implemented and we are monitoring the results.
We identified elevated load on couple of endpoints and actively working on mitigation
We are continuing to investigate the latency issue with Agent and REST APIs
We are continuing to investigate the latency issue with agent and REST APIs
We are investigating increased latency in our agent API
Report: "Increased latency for REST API"
Last updateThis incident has been resolved.
REST API latency has returned to normal levels. We continue to monitor the situation.
We have seen a drop in request latency due to our increase in resource allocation. We are allocating further resources in order to reduce latency to normal levels.
We have identified an increased number of requests to a particular endpoint and are working to mitigate the impact of the additional load. We have increase the available resources and continue to work on further mitigations.
We are currently investigating an issue of increased load on our REST API. The increase in load is causing elevated latency and request timeouts for some users.
Report: "Issue with delivery of email notifications"
Last updateThis incident has been resolved.
We are no longer experiencing errors with email delivery. We continue to monitor the situation.
We continued to see a minority of failures for mail delivery so we have switched to our backup mail provider.
We have identified an issue connecting to our upstream mail provider. Error rates have decrease however we are still experiencing issues with mail delivery.
We are experiencing errors with the delivery of email notifications and have begun investigating.
Report: "Increased job dispatch latency"
Last updateThis incident was caused by similar circumstances to our January 26th \(UTC\) incident. Details of the cause and our ongoing mitigations can be found in the postmortem available at [https://www.buildkitestatus.com/incidents/xb7h2m17fssf](https://www.buildkitestatus.com/incidents/xb7h2m17fssf)
We’ve applied the known mitigations and have seen an improvement in database query plan performance. We continue to work on a long term fix.
A fix has been implemented and we are monitoring the results.
We're investigating an issue which is causing increased job dispatch latency. We suspect this is a re-occurrence of a previous incident, which is caused by poor Postgres query performance due to an inefficient query plan. We're applying mitigations now to attempt to improve system performance
Report: "Elevated Latency"
Last updateThis incident has been resolved.
We have investigated some recent reports of increased latency, however the issue has subsided. We are continuing to monitor the situation.
Latency and Agent API have improved, we are continuing to monitor the situation and identify the root cause.
We are actively investigating this issue
We are investigating reports of increased latency